
When you’re shopping for a mortgage in Richmond, Chesterfield, Virginia Beach, or anywhere across Virginia, the difference between a good rate and a great rate often comes down to how much information you can access — and how quickly. Most homebuyers walk into lender conversations at a disadvantage, not because they aren’t smart, but because the tools exist and nobody told them about them.
Mortgage rate transparency tools help you cut through the noise, compare real numbers side by side, and walk into any lender conversation knowing exactly what to ask. Some are broad rate aggregators. Some are credit-safe shopping platforms. Some are government benchmarks. Together, they form a complete toolkit for making a confident, informed mortgage decision.
We’ll also show you how to use breakeven math to evaluate rate offers, because the lowest rate isn’t always the best deal. Here are the top tools that give homebuyers in Virginia (and buyers in FL, TN, and GA) a genuine edge.
1. Fetch My Mortgage
Best for: Virginia homebuyers who want to shop hundreds of lenders with zero credit score impact
Fetch My Mortgage is a Virginia-based mortgage comparison platform that shops hundreds of lenders simultaneously using NoTouch Credit technology, with no hard inquiry and no impact to your credit score.

Where This Tool Shines
Most rate comparison tools show you advertised rates from a handful of lenders. Fetch My Mortgage is structurally different: it operates as a broker platform with access to hundreds of lenders, meaning one submission generates real competing offers across a network that no single bank or credit union can match. That’s not a marketing claim — it’s a fundamental difference in how the platform works.
For borrowers who’ve been turned down by a bank or credit union, this matters enormously. The lender network available through a broker marketplace includes options that simply don’t exist inside a single institution’s product set. Fetch My Mortgage accepts credit scores starting at 500, which aligns with FHA guidelines for borrowers putting 10% down — a segment that many traditional lenders decline at the door.
Key Features
NoTouch Credit (Vantage Score 4.0): A soft pull only — no hard inquiry, no credit score impact, no matter how many lenders are shopped simultaneously.
Hundreds of Lenders, One Submission: Rather than applying to multiple lenders individually (each with their own hard pull), one submission reaches the full network at once.
Minimum 500 Credit Score: Serves borrowers who have been declined by conventional banks, including FHA-eligible buyers at the lower end of the credit spectrum.
Cash-Out Refinances to 90% LTV: One of the higher LTV thresholds available for cash-out refinancing, giving homeowners more access to their equity.
24/7 Availability and Fast Close Times: Operates around the clock with a focus on speed to close — a meaningful advantage in competitive Virginia markets like Short Pump, Glen Allen, and Chesterfield.
Best For
Homebuyers and homeowners in VA, FL, TN, and GA — including Richmond, Midlothian, Fredericksburg, Spotsylvania, Williamsburg, Virginia Beach, Roanoke, Lynchburg, and surrounding areas. Especially valuable for borrowers with credit scores between 500 and 620, those recently turned down by a bank, and anyone who wants to generate real competing offers without a credit hit.
Pricing
No cost to shop rates. Compensation flows through lender-paid structures. There are no hidden fees to initiate a rate comparison.
Led by Duane Buziak, Mortgage Maestro, NMLS#1110647.
2. CFPB Loan Estimate Explainer Tool
Best for: First-time buyers who want to understand and compare official lender disclosures
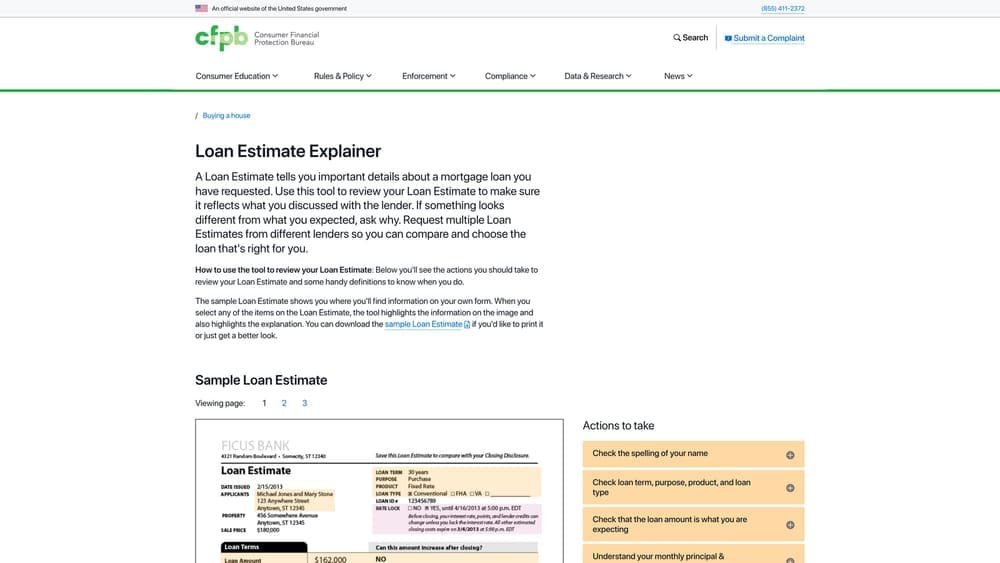
The CFPB Loan Estimate Explainer is a free government resource that teaches homebuyers how to read, understand, and compare the official Loan Estimate form every lender is legally required to provide.
Where This Tool Shines
Under TRID (TILA-RESPA Integrated Disclosure) rules, every lender must provide a standardized Loan Estimate within 3 business days of application. This form is your legal right — and it’s the single most powerful document for comparing offers apples-to-apples. The CFPB tool walks you through every line item interactively, so you know exactly what you’re looking at.
Many buyers receive Loan Estimates from multiple lenders and don’t know how to compare them. This tool eliminates that confusion. It’s particularly useful for identifying origination fees, discount points, prepaid interest, and escrow setup costs that can dramatically change the true cost of a loan even when the interest rate looks competitive.
Key Features
Interactive Line-Item Walkthrough: Every section of the Loan Estimate explained in plain language, with tooltips and examples.
Fee Identification Guide: Helps buyers spot origination charges, third-party fees, and prepaid items that lenders sometimes bury.
APR vs. Interest Rate Clarity: Explains why the APR on your Loan Estimate is the more complete cost comparison figure.
No Account Required: Fully accessible, government-maintained, and always free.
Best For
First-time homebuyers in Virginia who have received Loan Estimates from multiple lenders and want to understand what they’re actually comparing. Also valuable for experienced buyers who want to verify they aren’t missing hidden costs in the fine print.
Pricing
Free. No registration, no account, no data collection required.
Understanding Breakeven Math Before You Compare Rates
Before diving further into rate tools, it’s worth pausing on a concept that changes how you evaluate every rate offer you receive: breakeven math. The lowest rate isn’t always the best deal — especially when discount points are involved.
The breakeven formula is straightforward: Points paid ÷ Monthly savings = Months to break even.
Here’s a worked example using a $350,000 loan. This is an illustrative calculation using standard amortization math, not a guarantee of any specific rate or outcome.
Scenario: You’re offered a choice between 7.25% with no points, or 7.00% if you pay 1 discount point ($3,500 upfront).
Monthly P&I at 7.25% on $350,000 (30yr): approximately $2,389
Monthly P&I at 7.00% on $350,000 (30yr): approximately $2,329
Monthly savings: approximately $60
Breakeven: $3,500 ÷ $60 = approximately 58 months (4.8 years)
If you plan to sell, move, or refinance before 58 months, paying that point does not benefit you financially. If you plan to stay in the home long-term, it may be worth it. The math tells you which scenario applies to your situation.
Now here’s a rate-payment reference table to help you benchmark offers you receive. All figures are illustrative estimates based on standard 30-year amortization and should not be treated as guaranteed rates or payments.
Illustrative Rate-Payment Reference Table (30-Year Fixed, Principal and Interest Only)
$300,000 Loan | 6.75% Rate | ~$1,945/month P&I | ~$97,500 total interest (5yr) | ~$400,200 total interest (30yr)
$300,000 Loan | 7.00% Rate | ~$1,996/month P&I | ~$99,600 total interest (5yr) | ~$418,600 total interest (30yr)
$300,000 Loan | 7.25% Rate | ~$2,047/month P&I | ~$101,800 total interest (5yr) | ~$437,100 total interest (30yr)
$350,000 Loan | 6.75% Rate | ~$2,269/month P&I | ~$113,800 total interest (5yr) | ~$466,900 total interest (30yr)
$350,000 Loan | 7.00% Rate | ~$2,329/month P&I | ~$116,500 total interest (5yr) | ~$488,400 total interest (30yr)
$350,000 Loan | 7.25% Rate | ~$2,389/month P&I | ~$119,100 total interest (5yr) | ~$510,000 total interest (30yr)
Note: These figures are illustrative only. Actual payments include taxes, insurance, and any applicable mortgage insurance. Rates and payments will vary based on credit profile, loan type, and market conditions.
A quarter-point difference on a $350,000 loan adds up to more than $21,000 in total interest over 30 years. That’s why the tools below matter — they give you the data to negotiate, not just accept.
3. Freddie Mac Primary Mortgage Market Survey (PMMS)
Best for: Establishing a reliable national rate baseline before comparing lender offers
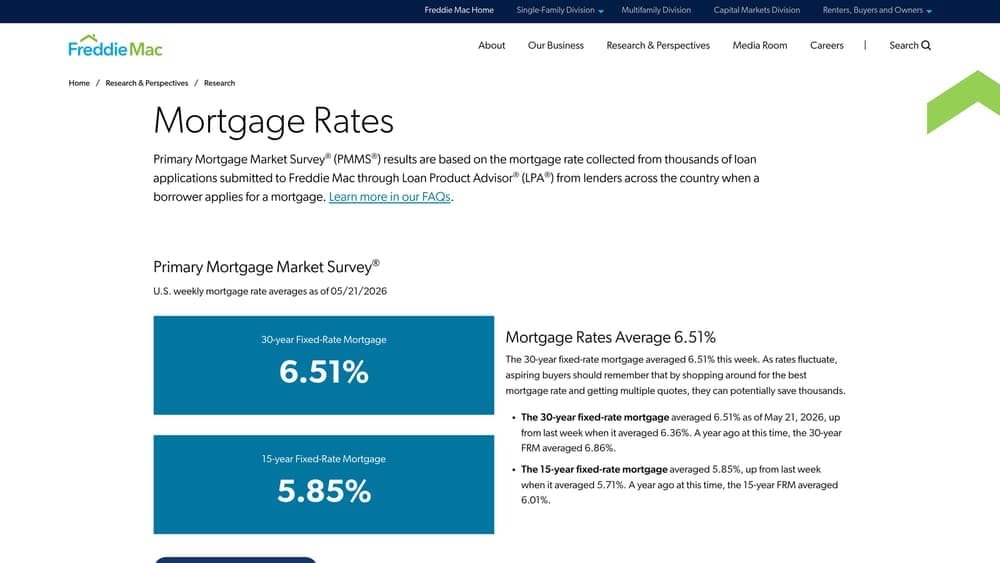
The Freddie Mac PMMS is the most widely cited weekly benchmark for U.S. mortgage rates, published every Thursday based on lender surveys across the country.
Where This Tool Shines
When a lender quotes you a rate, how do you know if it’s competitive? The PMMS gives you a verified, government-sponsored baseline for 30-year and 15-year fixed rates that’s updated weekly. It’s the same benchmark cited by major news outlets, financial publications, and housing economists. If a lender’s quote is significantly above the PMMS average, that’s a conversation worth having.
The PMMS also includes historical data going back decades, which helps you understand whether current rates are elevated or relatively low compared to long-term averages. That context matters when deciding whether to lock now or float while monitoring the market.
Key Features
Weekly 30-Year and 15-Year Fixed Rate Averages: Published every Thursday, sourced from lender surveys across the country.
Historical Rate Data: Decades of archived data available for trend analysis and context.
Government-Sponsored Source: Freddie Mac is a federally chartered enterprise — this data carries institutional credibility.
Free and Publicly Accessible: No registration, no paywall, no account needed.
Best For
Any homebuyer who wants a credible, unbiased national benchmark to hold lender quotes against. Particularly useful at the start of your rate shopping process to calibrate your expectations before talking to any lender.
Pricing
Free. Publicly available at freddiemac.com.
4. Bankrate Mortgage Rate Comparison
Best for: Buyers who want a live rate table showing both interest rate and APR side by side
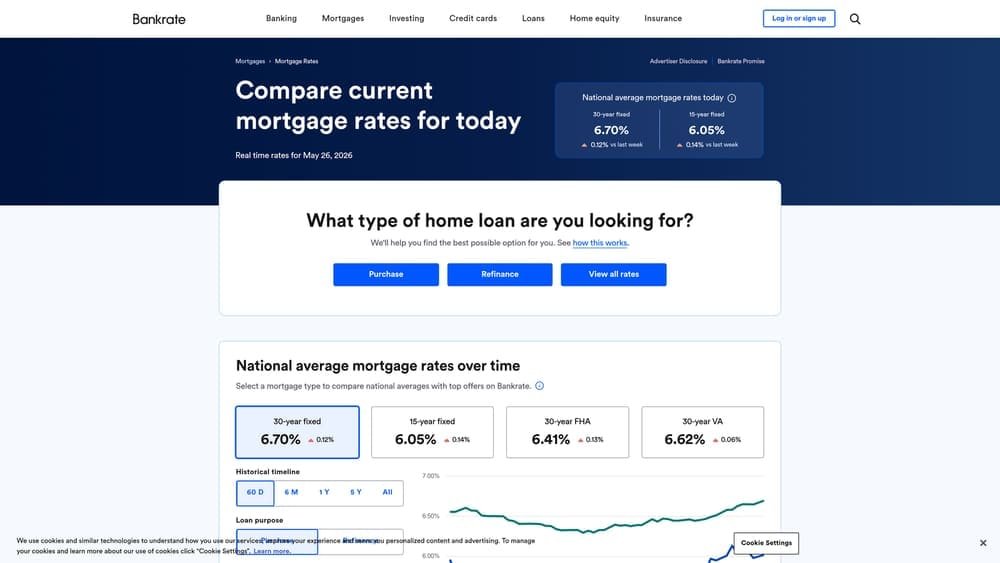
Bankrate’s mortgage rate tool displays a live comparison table updated daily, showing interest rates and APR across multiple lenders so buyers can see the true cost of borrowing — not just the headline number.
Where This Tool Shines
One of the most common ways homebuyers get misled is by comparing interest rates without looking at APR. The APR (Annual Percentage Rate) incorporates lender fees, origination charges, and other costs into a single annualized figure — making it a more complete measure of what you’re actually paying. Bankrate’s table displays both, which immediately surfaces lenders who advertise a low rate but charge high fees.
The filtering options are genuinely useful. You can sort by loan type, term, and purpose, so you’re not comparing a 30-year fixed against an ARM or a jumbo loan against a conventional. That kind of apples-to-apples comparison is harder to find than it should be.
Key Features
Daily-Updated Rate Table: Live data reflecting current market conditions, not stale advertised rates.
APR Alongside Interest Rate: Both figures displayed simultaneously so buyers can evaluate true cost, not just the teaser rate.
Loan Type Filters: Filter by 30-year fixed, 15-year fixed, ARM, FHA, VA loan, and jumbo categories.
Fee Visibility: Some lender listings include estimated points and fees, adding another layer of transparency.
Best For
Buyers who want a broad market snapshot quickly and want to understand the relationship between rate and APR before entering lender conversations. Good as a secondary reference alongside a platform like Fetch My Mortgage that generates actual competing offers.
Pricing
Free to use. Bankrate earns revenue through lender advertising, which is worth noting when evaluating which lenders appear prominently in results.
5. NerdWallet Mortgage Rate Tool
Best for: Buyers who want rate estimates filtered by their actual credit score range and loan scenario
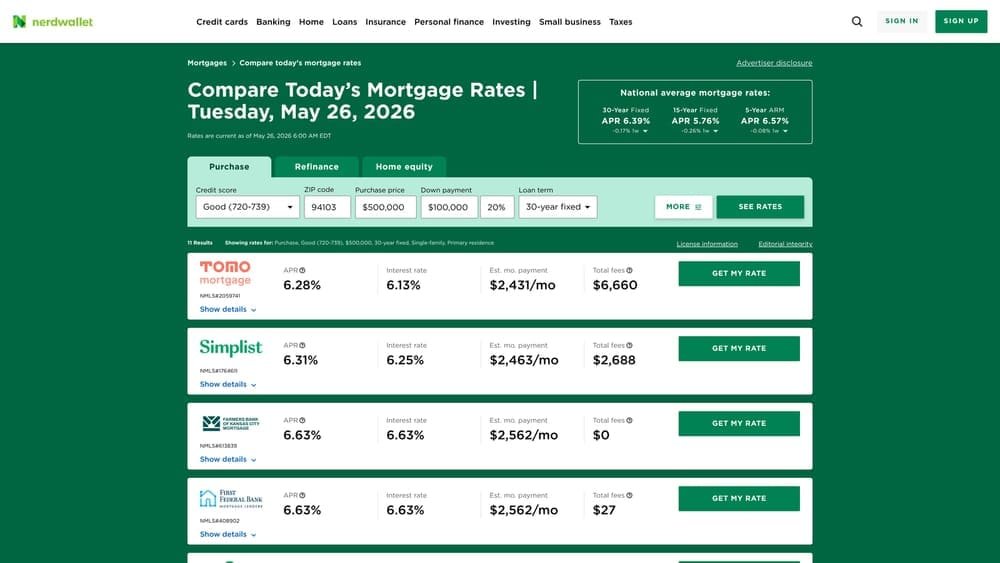
NerdWallet’s mortgage rate tool allows buyers to input their credit score range, down payment, home price, and loan purpose to receive more relevant rate comparisons rather than generic advertised rates.
Where This Tool Shines
Generic rate tables show you what a borrower with excellent credit and 20% down might receive. NerdWallet’s filtering lets you get closer to what someone in your actual credit profile might see. That’s a meaningful distinction — a buyer with a 640 credit score and 5% down is in a fundamentally different rate environment than the advertised headline rates suggest.
The tool also includes lender ratings and user reviews alongside rate data, which adds a qualitative layer that pure rate tables lack. Knowing that a lender offers a competitive rate but has a history of slow processing or poor communication is useful information before you commit to an application.
Key Features
Credit-Score-Tiered Estimates: Rate results adjust based on your selected credit score range, giving a more realistic picture of what to expect.
Scenario Filters: Input loan type, term, loan purpose (purchase vs. refinance), and down payment for more targeted results.
APR Displayed Alongside Rate: Both figures shown for every lender listed.
Lender Reviews and Ratings: User-generated ratings give context beyond the rate number alone.
Best For
Buyers who want to understand how their credit score affects the rates available to them, and who want to research lender reputation alongside pricing. Works best as a research and benchmarking tool rather than a final rate-shopping step.
Pricing
Free to use. NerdWallet earns referral fees from lenders, which influences which lenders are featured.
How Fetch My Mortgage Compares to Single-Lender Competitors
It’s worth being direct about how these tools and platforms compare, because the structural differences matter to your outcome as a borrower.
Competitors like Rocket Mortgage, Movement Mortgage, C&F Mortgage Corporation, CapCenter, Atlantic Bay Mortgage, Alcova Mortgage, Prosperity Mortgage, and others listed in the Virginia market are single-lender or single-institution models. They can only offer you their own products. If their guidelines don’t fit your profile, the answer is no.
Fetch My Mortgage operates as a broker platform with access to hundreds of lenders. That’s a structural difference. Here’s what it means in practice:
If a bank turns you down: A single lender’s decline is final. A broker platform shops the same scenario across hundreds of lenders, some of which have different overlays, different guidelines, and different appetite for your specific credit profile.
On credit score minimums: Many conventional lenders require 620+. FHA guidelines allow down to 580 (3.5% down) or 500 (10% down) per HUD policy. Fetch My Mortgage serves borrowers at 500 — a range that many Virginia bank branches and single-institution lenders simply won’t touch.
On credit inquiries: Platforms like LendingTree operate on a competing-offer model, but they do involve a credit inquiry. Fetch My Mortgage’s NoTouch Credit uses a Vantage Score 4.0 soft pull — no hard inquiry, no credit score impact, no matter how many lenders are accessed in the same submission.
On rate competition: When hundreds of lenders compete for your loan simultaneously, the competitive pressure on pricing is fundamentally higher than when you’re negotiating with a single institution that has no incentive to sharpen its pencil.
This isn’t about saying any competitor is bad at what they do. It’s about recognizing that a marketplace model and a single-lender model are solving different problems. If you’ve already been turned down, or if your credit score is below 620, the marketplace model is the relevant one for your situation.
Frequently Asked Questions About Mortgage Rate Transparency
What is a Loan Estimate and when must a lender provide one?
A Loan Estimate is a standardized three-page disclosure form that every mortgage lender is legally required to provide within 3 business days of receiving your loan application. It was introduced under TRID (TILA-RESPA Integrated Disclosure) rules and shows your estimated interest rate, monthly payment, closing costs, and loan terms in a consistent format across all lenders. This makes it the most reliable document for comparing offers side by side.
How do I know if a mortgage rate is competitive in Virginia?
Start with the Freddie Mac PMMS as your national baseline, published every Thursday. Then use tools like Bankrate or NerdWallet to see where advertised rates are landing for your loan type. Finally, generate actual competing offers through a platform like Fetch My Mortgage to see what lenders will actually commit to for your specific profile. The gap between advertised rates and real offers can be significant depending on your credit score, down payment, and loan amount.
Does comparing mortgage rates hurt my credit score?
It depends on the platform. Traditional lender applications involve a hard credit inquiry, which can temporarily reduce your score. Multiple hard inquiries within a short window (typically 14-45 days depending on the scoring model) are often treated as a single inquiry for mortgage purposes under FICO models. However, Fetch My Mortgage’s NoTouch Credit uses a Vantage Score 4.0 soft pull — zero hard inquiry, zero credit score impact, regardless of how many lenders are shopped.
What’s the difference between interest rate and APR?
The interest rate is the base cost of borrowing the principal, expressed as a percentage. The APR (Annual Percentage Rate) includes the interest rate plus lender fees, origination charges, and certain other costs, expressed as a single annualized figure. APR is almost always higher than the interest rate and is the more complete measure for comparing the true cost of two loan offers. A lender with a lower rate but higher fees may have a higher APR than a lender with a slightly higher rate and minimal fees.
Can I get a mortgage with a 500 credit score in Virginia?
Yes, under FHA guidelines, borrowers with a credit score of 500 to 579 may qualify for an FHA loan with a minimum 10% down payment. Borrowers at 580 and above may qualify for FHA with as little as 3.5% down. These are federal HUD guidelines. Not all lenders accept borrowers at the lower end of that range due to their own internal overlays, which is why a broker platform with access to hundreds of lenders — like Fetch My Mortgage — is often the most practical path for borrowers in the 500-620 credit score range.
What Virginia cities and counties does Fetch My Mortgage serve?
Fetch My Mortgage serves homebuyers and homeowners throughout Virginia, including Richmond, Short Pump, Glen Allen, Chesterfield, Midlothian, Henrico, Hanover, Fredericksburg, Spotsylvania, Stafford, Prince William, Ashland, Lake Anna, Goochland, Louisa, Caroline County, Charlottesville, Albemarle, Williamsburg, Yorktown, Suffolk, Hampton Roads, Newport News, Chesapeake, Virginia Beach, Roanoke, and Lynchburg. The platform also operates in Florida, Tennessee, and Georgia.
What does ‘NoTouch Credit’ mean and how does it work?
NoTouch Credit is Fetch My Mortgage’s soft-pull credit review process. Instead of a hard inquiry — which appears on your credit report and can temporarily lower your score — the platform uses a Vantage Score 4.0 soft pull to assess your credit profile. This means you can shop hundreds of lenders simultaneously and generate real rate comparisons without any impact to your credit score. It’s a meaningful distinction compared to platforms or lenders that require a hard pull before showing you any rates.
Which Tool Is Right for Your Situation
Mortgage rate transparency starts with knowing where to look — and knowing what the numbers actually mean. The tools in this list serve different purposes, and the highest-leverage approach is combining two or three of them strategically.
Use the Freddie Mac PMMS to establish a credible national baseline before you talk to anyone. Use the CFPB Loan Estimate Explainer once offers arrive so you can read every line item with confidence. Use Bankrate or NerdWallet to understand the rate landscape for your loan type and credit profile. Then use Fetch My Mortgage’s NoTouch Credit platform to generate real competing offers across hundreds of lenders with zero credit score impact.
For Virginia homebuyers in Richmond, Chesterfield, Midlothian, Fredericksburg, Virginia Beach, Williamsburg, or anywhere else in the state, that last step is especially important if you’ve been turned down by a bank or credit union, or if your credit score falls between 500 and 620. The lender network available through a broker marketplace is fundamentally different from what any single institution can offer — and that difference shows up directly in the rate you’re quoted.
Remember the breakeven math: a quarter-point rate difference on a $350,000 loan represents more than $21,000 in total interest over 30 years. The effort it takes to shop properly pays for itself many times over.
Learn more about our services and start a no-credit-hit rate check today. No hard pull. No pressure. Just real numbers from hundreds of lenders competing for your loan.